
Beyond the Bullion: Inflation Risks Resurface
Credit: World Gold Council
On January 2024, gold remained stagnant despite favourable season conditions, following its record-breaking highs in late 2023. Global gold ETF outflows reduced speculative interest, and the strength of long-term Treasuries and the US dollar, fuelled by positive US economic surprises, were the key factors holding back gold’s upward momentum.
Gold Pulls Back After Earlier Increases
Gold prices declined to US$2.053 per ounce, ending the month 1% lower, which diverged from historical seasonal strength (Table 1). This decrease followed a strong year-end performance. According to Gold Return Attribution Model (GRAM) (Chart 1), factors contributing to the decline included significant outflows from global gold ETFs (51 tonnes) and a reduction in net long positions in COMEX futures (-206 tonnes). Additionally, higher Treasury yields and the US dollar have driven by better-than-expected US economic performance, dashed hopes of imminent monetary policy cuts, further pressuring gold prices.
Chart 1: Investor outflows and positive economic surprises weighed on gold in January

*Data to 31 January 2024. Source: Bloomberg, World Gold Council
Table 1: Despite seasonal tailwinds, gold prices fell across the board
Gold price and returns in key currencies*
|
|
USD (oz) |
EUR (oz) |
JPY (g) |
GBP (oz) |
CAD (oz) |
CHF (oz) |
INR (10g) |
RMB (g) |
TRY (oz) |
AUD (oz) |
|
31 January 2024 |
2,053 |
1,892 |
9,662 |
1,614 |
2,750 |
1,765 |
54,819 |
473 |
62,332 |
3,113 |
|
January return |
-1.2% |
0.5% |
2.5% |
-1.1% |
-0.1% |
0.9% |
-1.4% |
-0.3% |
1.6% |
2.0% |
|
Y-T-D return |
-1.2% |
0.5% |
2.5% |
-1.1% |
-0.1% |
0.9% |
-1.4% |
-0.3% |
1.6% |
2.0% |
*Data to 31 January 2024. Based on the LBMA Gold Price PM in USD, expressed in local currencies. Source: Bloomberg, ICE Benchmark Administration, World Gold Council
Future prospects in focus
Based on the concerns raised from certain Fed members and positive economic data have diminished the likelihood for a March interest rate cut, compounded by a more hawkish stance from the European Central Bank (ECB) turn
However, decline interest rates benefit gold, historical patterns suggest that the initial rate cut by the Fed after a series of hikes tends to have limited impact. Gold tends to see short-term rallies only when there is a significant economic or equity downturn, leading to lower long-term maturity yields (Chart 2).
Chart 2: Gold’s performance post the first cut has been underwhelming

*Data to 31 January 2024. Source: Bloomberg, World Gold Council
Navigating the road back to target inflation is proving challenging. Recent developments could disrupt the smooth decline in inflation the US has experienced, potentially delaying policy easing beyond March
In the face of favourable financial conditions indicating short-term economic ease, rising GDP could hinder inflation's descent. Labour costs are on the rise, driven by small business compensation plans, while rents are expected to contribute to core inflation in January and February. Additionally, tensions in the Red Sea are impacting freight costs, potentially leading to supply chain pressures reminiscent of the 2022 inflation surge in Europe (Chart 3). Despite current data suggesting potential cuts in core Personal Consumption Expenditures, controlling inflation remains uncertain.
In summary of the above
In the coming month, rising inflation and strong employment data may lead to an increase in bond yields, which could potentially pose challenges for gold prices.
However, higher yields could also create pressure on equities which appear to overvalued and prone to volatility. Moreover, a series of upcoming elections and geopolitical uncertainties could further contribute to market instability. This uncertain environment may prompt some investors to maintain a cautious stance, keeping a portion of their investments in gold as leverage.
Chart 3: Red Sea tensions could compound inflation risks three-month moving average of y/y changes in the US
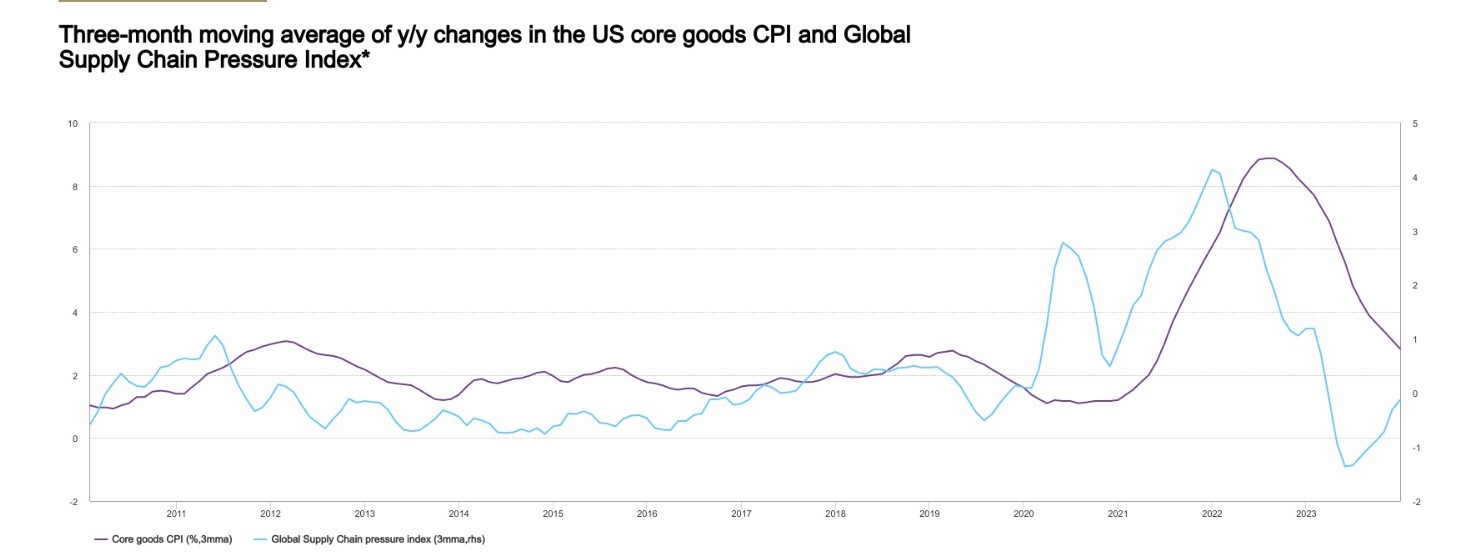
*Data to 31 January 2024. Source: Bloomberg, World Gold Council